





Your operations team wants a RON platform. Your CFO wants a number. “Show me the return” is the conversation that decides whether the project moves forward or dies in a budget meeting.
Most teams answer with the headline stat: lenders save up to $444 per loan. They pull the number from the MarketWise Advisors study, paste it into a slide, and assume the math speaks for itself.
It does not. Your CFO will ask three follow-up questions. “What does it cost us to implement?” “When do we break even?” “How do we know the savings are real and not a vendor marketing claim?”
If you cannot answer all three with your own data, the project stalls. Industry benchmarks open the door. Your internal metrics close the deal.
Why ROI Measurement Matters Beyond the Business Case
A strong ROI framework does more than win budget approval. It tracks whether the platform delivers what the vendor promised. Identifies which transaction types benefit most from RON. It reveals operational problems that generic reporting misses. And it gives leadership a quarterly proof point that justifies ongoing investment.
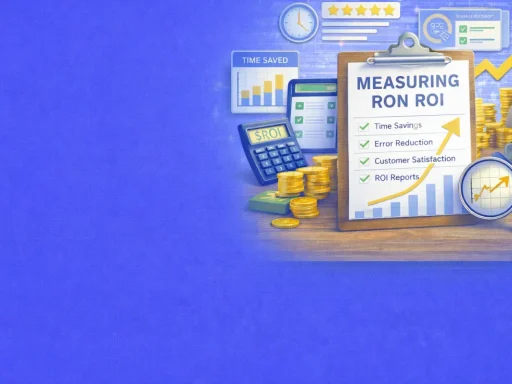
This guide covers how to calculate time savings, measure error rate reduction, track customer satisfaction, build ongoing ROI reports, and avoid the measurement mistakes that undermine credibility with finance teams.
The Industry Benchmarks: What the Data Shows
Before building your own model, understand what independent research has found. These numbers set the baseline for your projections.
The MarketWise Advisors Study
MarketWise Advisors independently evaluated the financial and operational impact of eClosing with RON. The study surveyed 661 lenders and settlement agents in Q4 2021. The findings remain the most comprehensive RON ROI data available.
For lenders, full eClosings with RON save up to $444 per loan. That figure includes direct time savings, quality improvement, and eliminated costs for printing, shipping, and document handling. Hybrid eClosings (some digital, some paper) save $154.52 per loan. Adding RON to a hybrid process bumps savings to $211.97 — a 37% uplift. Moving from hybrid with eNote to full eClose with RON, eVault, and eRegistry delivers the full $444 — a 91% uplift.
For title agents, RON saves up to $100 per transaction. That comes from reduced printing, shipping, time savings, and improved loan quality.
Time savings are equally dramatic. Full eClosings cut 157 minutes per transaction for lenders. Hybrid closings save 99 minutes. Title agents save up to 104 minutes per closing.
The study also found a 31% reduction in errors with eClosings. Platforms flag missed signatures, incomplete fields, and undated certificates before the session ends. And 87% of respondents said eClosings help close more loans with the same or fewer staff.
The ALTA Digital Closing Survey
ALTA‘s survey adds more context. 43% of title companies reported cost savings from digital closings. 52% reported closing time decreases. Average implementation cost was $30,000 — covering software, equipment, and training. And ALTA documented a 228% increase in title companies offering digital closings.
What the Benchmarks Do Not Tell You
These numbers describe the industry. They do not describe your operation. Your savings depend on your current process, your transaction mix, your volume, and your cost structure. A company that already runs an efficient paper process will see smaller gains than one drowning in mail-away closings. A high-volume operation recaptures its $30,000 implementation cost faster than a low-volume one.
The benchmarks prove RON delivers ROI at the industry level. Your job is proving it at your company level.
Metric 1: Time Savings Calculation
Time is the largest ROI component. It is also the easiest to measure — if you capture the right data points.
What to Measure
Track four time intervals for every closing. Document preparation time covers the minutes from when the closer receives the closing package to when it is ready for the signer. Session time covers the minutes the signer and notary spend in the live session. Post-closing processing time covers the minutes from session completion to when the final package reaches the lender or county recorder. Total cycle time covers the days from closing assignment to funded and recorded transaction.
Capture these intervals for both your traditional closings and your RON closings. The difference is your time savings per transaction.
How to Calculate the Dollar Value
Convert minutes into dollars using your fully loaded closer cost. If a closer earns $60,000 per year with $20,000 in benefits and overhead, the fully loaded cost is roughly $80,000 per year. At 2,080 working hours per year, that equals about $38 per hour or $0.64 per minute.
Multiply the minutes saved per RON closing by your per-minute cost. If RON saves 90 minutes per transaction at $0.64 per minute, each closing saves $57.60 in closer labor. At 200 closings per month, monthly labor savings reach $11,520.
Add savings from eliminated physical costs. Calculate your average spend per paper closing on printing, shipping, mobile notary fees, and courier services. Subtract the RON platform cost per transaction. The difference is your net savings per closing.
The Processing Cycle Shortcut
The MarketWise study found that lenders save up to seven days in the processing and funding cycle. That accelerated cycle has a financial value beyond labor savings. Faster funding reduces warehouse line interest costs. Faster recording reduces title risk exposure. For lenders carrying loans on warehouse lines at 6% to 8% annual interest, seven days of acceleration on a $300,000 loan saves roughly $350 to $460 in interest.
Most business cases ignore this line item. Adding it strengthens the financial argument considerably — especially for lenders with large warehouse line balances.
Metric 2: Error Rate Reduction
Errors cost more than the time to fix them. They delay closings, damage customer relationships, strain lender partnerships, and create compliance risk.
What Counts as an Error
Define your error categories before measuring. Common categories include missed signatures or initials, incorrect or incomplete notarial certificates, wrong document versions sent to the signer, identity verification failures that should have been caught earlier, and post-closing corrections required by the lender or county recorder.
Track errors at two levels: per-session errors (problems caught during the RON session by the platform’s automated checks) and post-closing errors (problems discovered after the session that require rework). The first category represents errors that RON prevented. The second represents errors that RON missed or that exist outside the notarization step.
Calculating Error Costs
Assign a dollar value to each error type. A missed signature on a paper closing might require a mobile notary visit ($75 to $150), staff coordination time (30 to 60 minutes), and a one- to three-day delay. A post-closing correction required by a lender might add $100 to $200 in direct costs plus relationship damage that is harder to quantify.
The MarketWise study found that lower error rates save lenders $17 to $23 per transaction. Your specific number depends on your error frequency and correction costs. Measure both before and after RON implementation to capture your actual reduction.
What No Other Guide Covers: The Compound Cost of the Second Error
Every ROI guide measures errors as isolated events. None of them track the compound cost that occurs when a single transaction generates more than one error — the pattern that consumes the most resources and creates the most damage.
A missed signature on page 37 triggers a correction cycle. The mobile notary visits the signer. The signer re-signs. The closer re-checks the package. During re-checking, the closer discovers that the notarial certificate date does not match the signing date — a second error that was invisible until the package came back for the first fix.
Now the correction cycle restarts. A new certificate must be prepared. The signer may need a third appointment. The lender’s funding deadline passes. The closing moves to the next day. Interest accrues on the warehouse line. The borrower’s rate lock approaches expiration.
The first error cost $150. The second error — discovered because of the first — cost $400 in direct expenses and delayed the transaction by two days. The compound cost of both errors together exceeds the sum of their individual costs because the second error extended the correction timeline created by the first.
RON platforms reduce compound errors by catching most problems during the session. A missed signature triggers an alert before the session ends. A date mismatch flags in real time. The notary fixes both issues on the spot. No correction cycles. No compounding.
Track compound errors specifically. Count transactions that required more than one correction cycle. Measure the total cost of those multi-error transactions. Compare the rate before and after RON. This metric often reveals ROI that single-error tracking misses entirely.
Metric 3: Customer Satisfaction
Satisfaction drives retention, referrals, and competitive positioning. It is harder to measure than time or errors — but equally important for a complete ROI picture.
Net Promoter Score (NPS)
Send a one-question survey after every closing: “How likely are you to recommend our company to a friend or colleague?” Score responses on a 0-to-10 scale. Promoters (9-10) minus detractors (0-6) equals your NPS.
Track NPS separately for RON closings and traditional closings. Compare the two. If RON closings consistently score higher, the platform improves your customer experience — a competitive advantage that shows up in retention and referral metrics over time.
Closing Experience Ratings
Add a second question specific to the closing process: “How would you rate your closing experience?” with a 1-to-5 scale. This captures satisfaction with the specific step RON touches, separate from satisfaction with the overall transaction.
A borrower may love their loan officer but hate the closing experience. Or vice versa. Isolating closing satisfaction reveals whether RON improves the part of the journey it is designed to improve.
Support Ticket Volume
Track the number of support tickets related to closings. Categories might include scheduling complaints, document errors, signer confusion, and technical problems. Compare ticket volume per 100 closings before and after RON.
Fewer tickets means less friction in the process. Each avoided ticket saves $10 to $25 in support labor. At 200 closings per month, a 30% reduction in closing-related tickets saves $600 to $1,500 monthly in support costs alone.
Building Ongoing ROI Reports
A one-time business case wins approval. Ongoing ROI reporting keeps the investment funded and the platform improving.
Monthly Dashboard
Build a monthly dashboard with five core metrics: RON transaction volume (total sessions and percentage of closings using RON), average time savings per closing (in minutes and dollars), error rate (errors per 100 closings, compared to paper baseline), customer satisfaction (NPS or closing experience score), and cost per closing (platform fees plus labor versus paper closing costs).
Present these metrics as trends, not snapshots. A single month’s data is noisy. Three months of data shows a direction. Six months reveals whether the platform is delivering sustained value.
Quarterly Executive Report
Every quarter, summarize the dashboard into a one-page executive report. Lead with total dollar savings for the quarter. Follow with the top three operational improvements (time, errors, satisfaction). Close with any issues or investments needed for the next quarter.
This report is the tool your operations leader uses to defend the RON budget. Make it concise, make it factual. Make it easy for a CFO to scan in two minutes and say “keep going.”
Annual Business Review
Once a year, conduct a full RON performance review. Compare annual results against the original business case projections. Did you hit the savings targets?, Did error rates drop as expected? and Did satisfaction improve?
Identify what exceeded expectations and what fell short. Adjust your model for the coming year. If the platform delivered $150,000 in annual savings against a $30,000 implementation cost and $60,000 in annual platform fees, the ROI is clear: $150,000 minus $90,000 equals $60,000 in net value, plus the qualitative benefits of faster closings and happier customers.
Common Measurement Mistakes
Flawed measurement undermines credibility. Avoid these errors when building your ROI model.
Using Industry Averages as Your Numbers
The $444-per-loan figure is compelling. It is also someone else’s number. Your CFO wants your company’s savings. Use industry benchmarks to justify the pilot. Use your own data to justify the investment.
Ignoring Implementation Costs
A business case that shows $100 per transaction in savings but omits the $30,000 implementation cost, the $5,000 integration fee, and the three weeks of closer training overstates ROI and loses credibility when finance discovers the omissions. Include every cost. Let the numbers speak honestly.
Measuring Only Direct Costs
Direct costs (platform fees, labor, printing) are easy to track. Indirect benefits (faster funding, fewer support tickets, improved customer retention) are harder to quantify but often larger. A business case built only on direct costs undersells the investment.
Stopping Measurement After Launch
The first 90 days of data are unreliable. Closers are learning. Processes are stabilizing. Error rates may temporarily rise before they drop. Stopping measurement after three months captures the worst performance period and misses the long-term gains.
Commit to 12 months of measurement minimum. The learning curve typically flattens by month three. Months four through twelve show the platform’s true performance.
Frequently Asked Questions
How much does RON save per closing?
Industry data shows up to $444 per loan for lenders with full eClosings and up to $100 per transaction for title agents. Your actual savings depend on your current process, volume, and cost structure. Measure your own baseline before and after implementation.
How long until RON pays for itself?
ALTA found the average implementation cost is $30,000. At $100 savings per transaction, a company closing 200 transactions per month recoups the investment in under two months. Lower-volume operations take longer. Factor in ongoing platform fees when calculating payback.
What is the most important ROI metric?
Time savings per closing is the largest single component. But compound error reduction often reveals hidden savings that time tracking alone misses. Track both for a complete picture.
How do I measure error rate reduction?
Define error categories. Count errors per 100 closings for both paper and RON transactions. Assign a dollar cost to each error type. Compare monthly rates before and after implementation. Track multi-error transactions separately to capture compound costs.
Should I measure customer satisfaction as part of ROI?
Yes. Customer satisfaction drives retention and referrals — both of which carry financial value. Track NPS and closing experience scores separately for RON and paper closings. Compare over time.
How often should I report RON ROI?
Monthly dashboards for operations. Quarterly executive summaries for leadership. Annual business reviews to compare actual results against projections. Continuous measurement keeps the platform accountable and funded.
What ROI do other companies report?
The MarketWise study found ROI ranging from $7.73 per dollar invested for hybrid eClosings to $9.86 for full eClosings. National Mortgage News reported that 87% of surveyed companies believe eClosings help close more loans with the same or fewer staff.
What costs should I include in my ROI model?
Include platform subscription or per-transaction fees, implementation and integration costs, staff training time and productivity loss, ongoing technical support, and any additional bonds or insurance. Compare total costs against total savings — not just the per-transaction rate against the per-transaction savings.
Conclusion:
A RON business case lives or dies on measurement. Industry benchmarks open the conversation. Your own data closes it.
Start with the baseline: how long do your closings take today, how many errors do you fix per month, and what does each one cost? Implement RON. Measure the same metrics. Report the difference monthly. Build the dashboard your CFO can scan in two minutes. And track compound errors — the multi-fix transactions that consume the most resources and hide the most savings.
The companies that keep their RON platforms funded are not the ones that quoted the $444 number in the original pitch. They are the ones that proved their own number every quarter afterward.
For companies building a measurable RON business case, BlueNotary provides a platform with reporting tools, audit trail data, and the transaction volume to generate the metrics that finance teams require.